
Interactive EMF data visualization on city maps
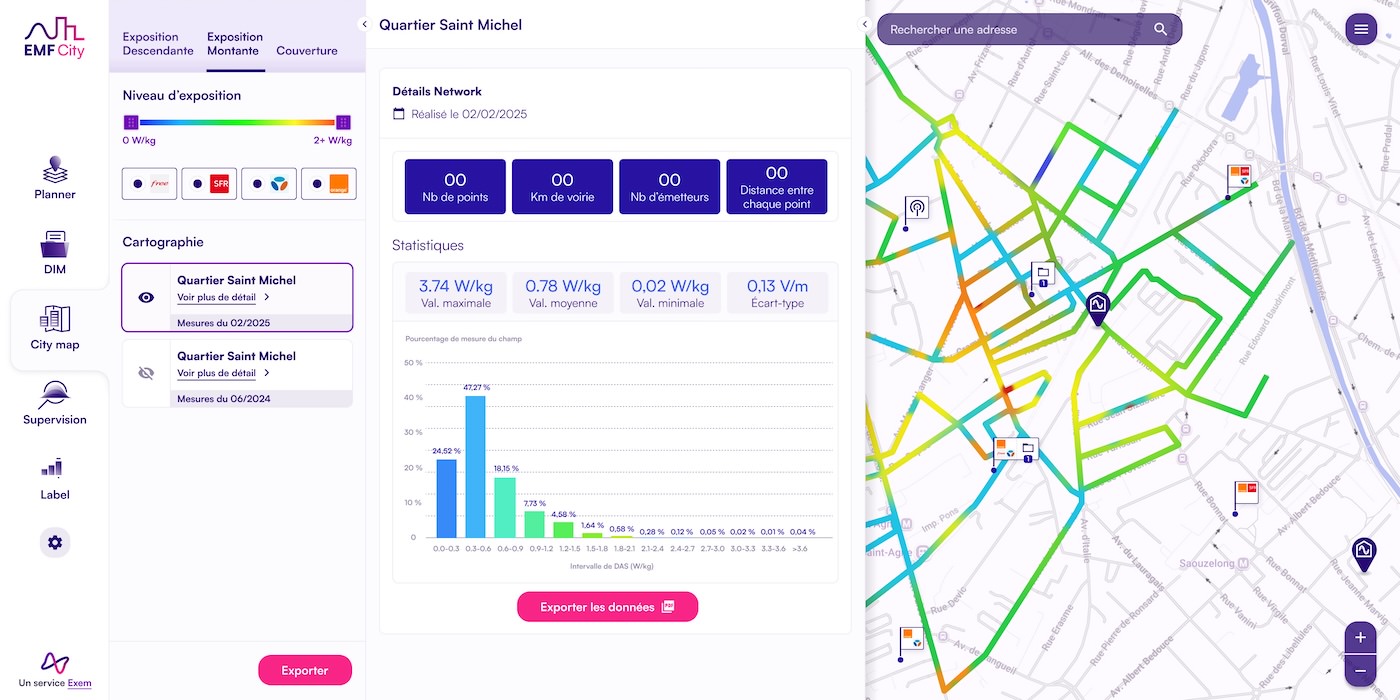
Exem monitors electromagnetic fields across France (radio, cellular, every operator). Cities and local authorities rely on its tools for public-health transparency: measured waves, network coverage, 3D antenna projections, and the administrative paperwork that follows them. That offer lived in a handful of small, inconsistent apps; this project merges it into one coherent web application: site-planning tools, cartography layers, clustered measurement points and data-exploration panels, all on the same interactive map.
I built it from scratch as the sole front-end in a two-person product team. Under the map work, the foundation is a Storybook-driven component library: 100+ components implemented from the Figma designs, each built skeleton-first, so loading states are a property of the system rather than an afterthought. API types are generated from the OpenAPI specs, so the front-end cannot drift from the backend contract; i18n was in from day one.
Stack bets: TanStack Start over an ever-heavier Next.js, and React Strict DOM (close to the DOM and accessible by default, while keeping the cross-platform door open). A budget cut ended the mission before launch; the front-end was handed over near-complete to Exem's in-house team.